Give your students engaging, seasonal practice with graphing proportional relationships, identifying the constant rate of change, and working with linear equations in the form y=kx. This Spring-themed activity is perfect for warm-ups, stations, partner work, end of year review or independent practice as students strengthen their understanding of linear relationships. Final product is a fun coloring page perfect for bulletin boards.
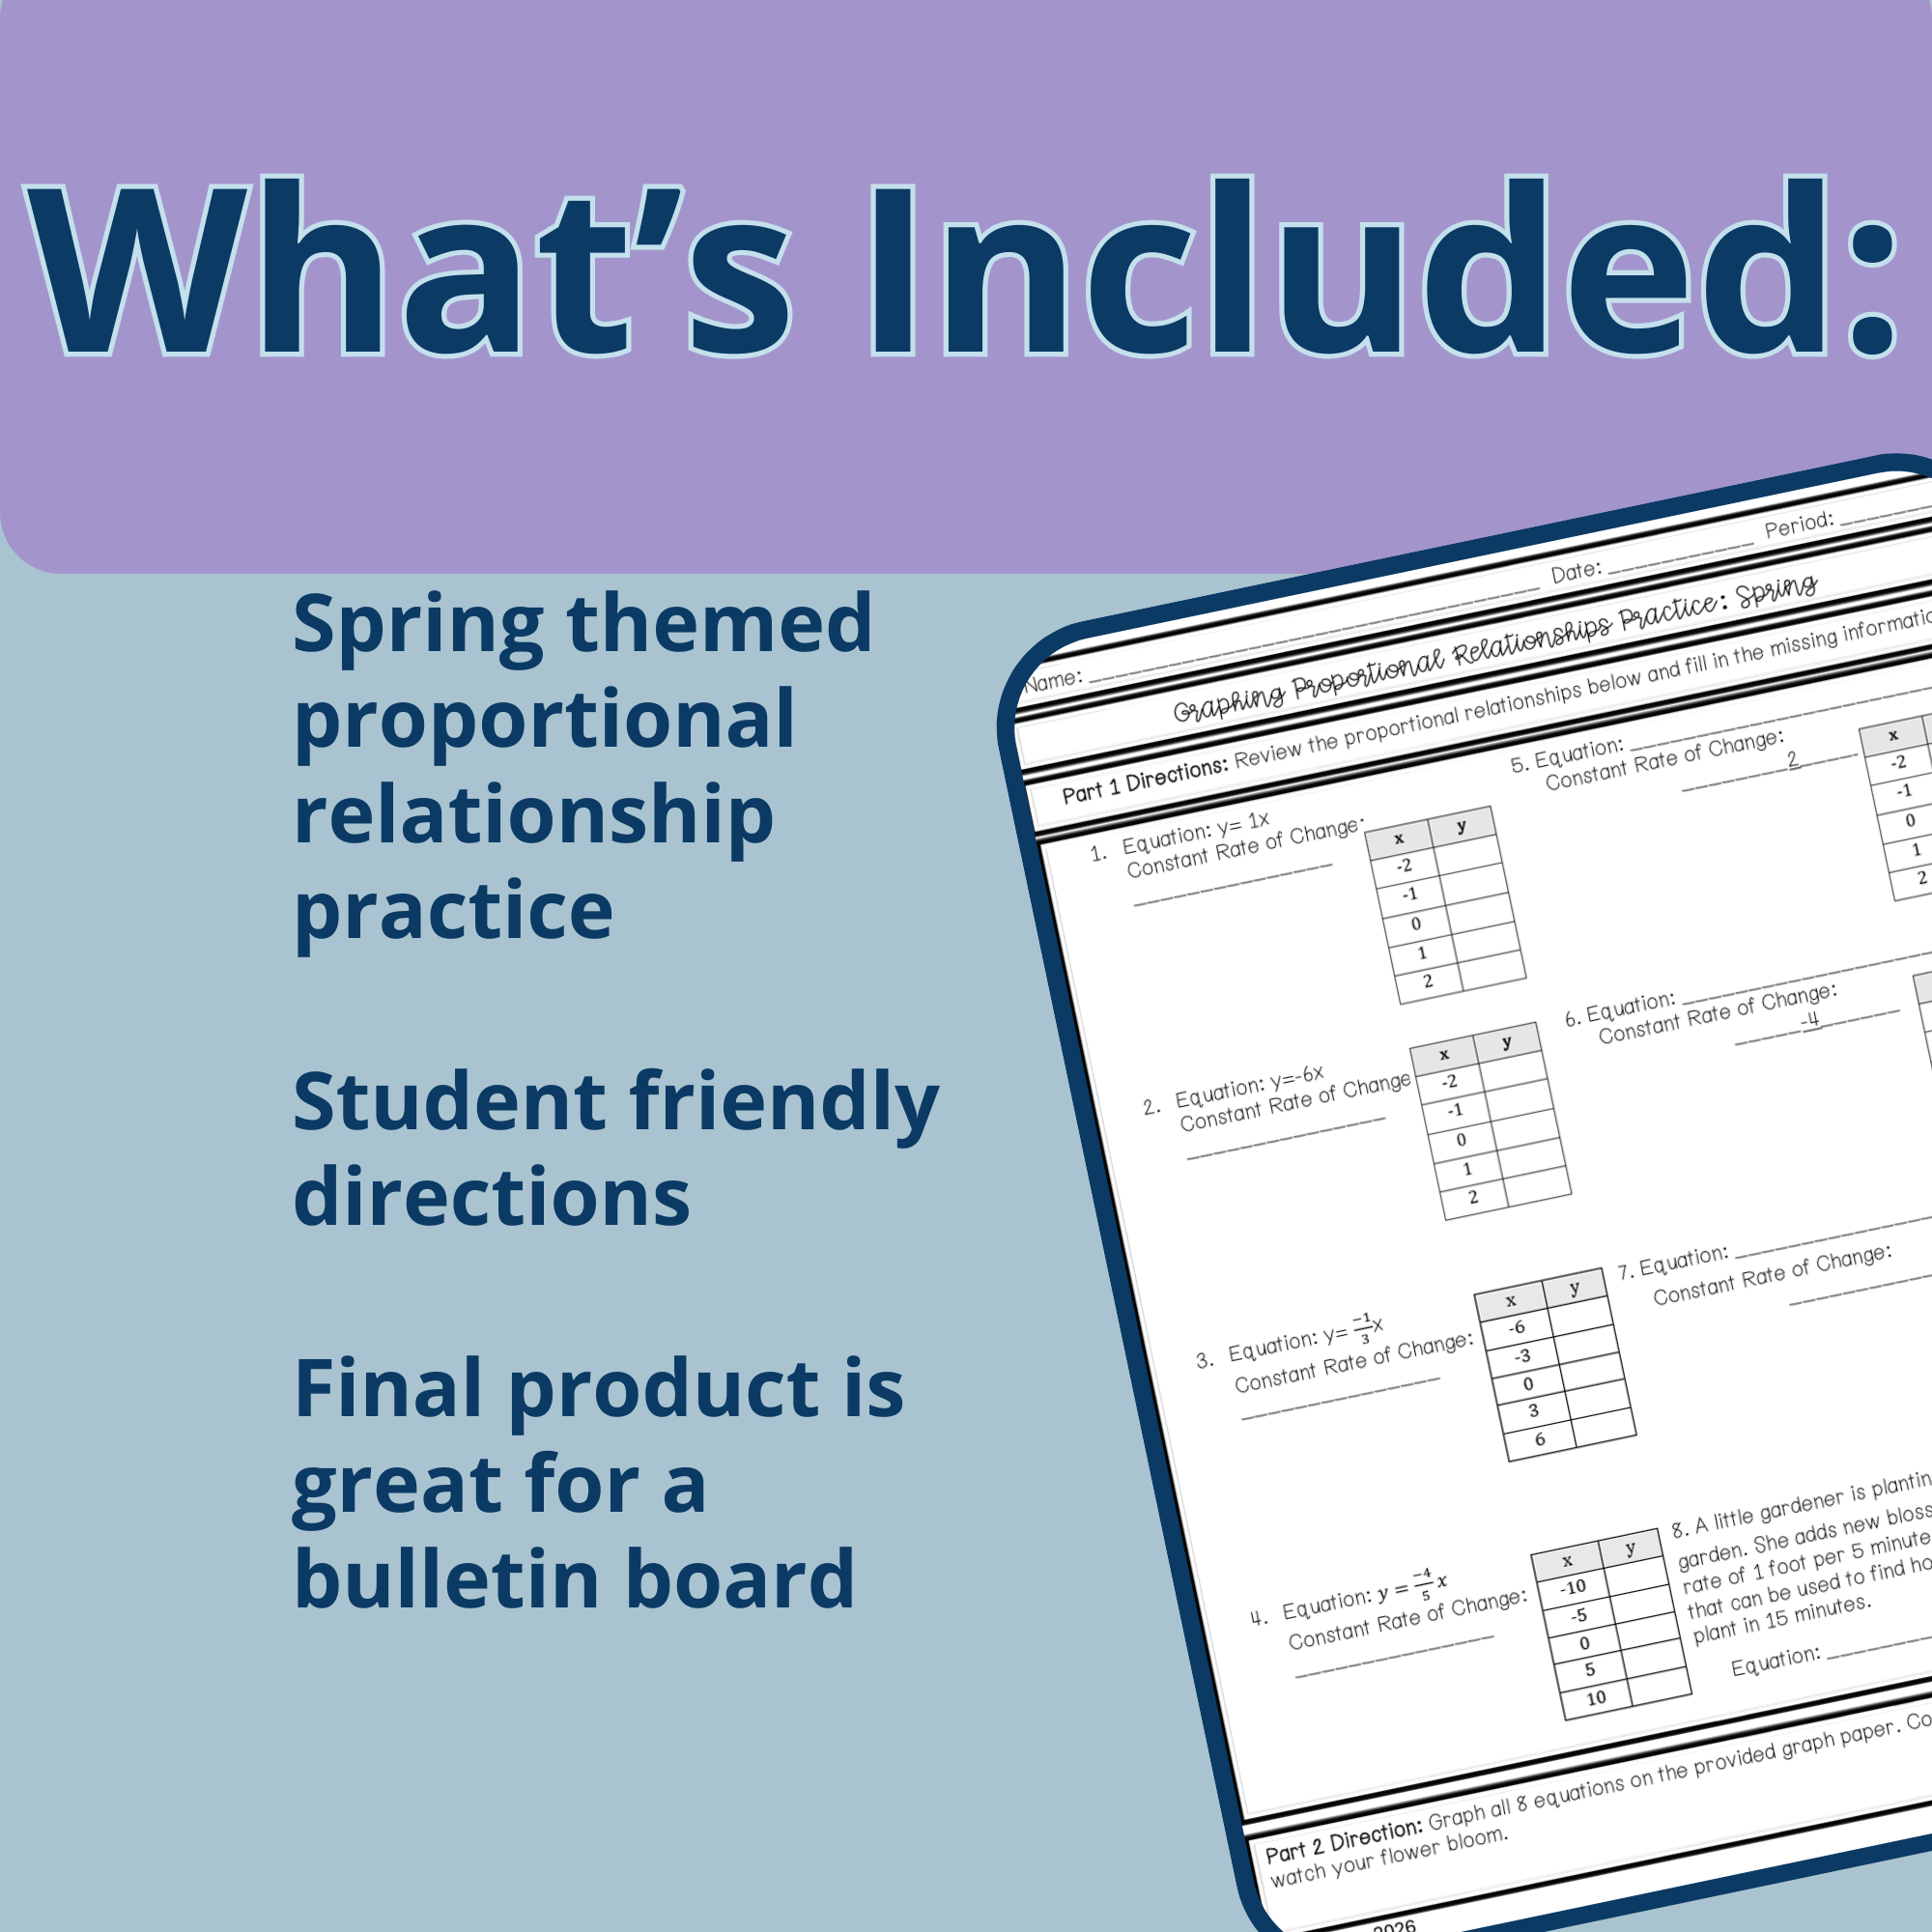
✨ What's Included:
8 linear equations presented in direct variation form, just waiting to be graphed!
A dedicated student sheet for easily identifying constant rate of change
A spacious graphing page where all eight equations will come together to form a cute Spring display.
Crystal-clear, step-by-step directions that make this activity a breeze to implement.
A stunning finished product that’s perfect for a vibrant bulletin board display that will wow everyone!
📚 Learning Objectives
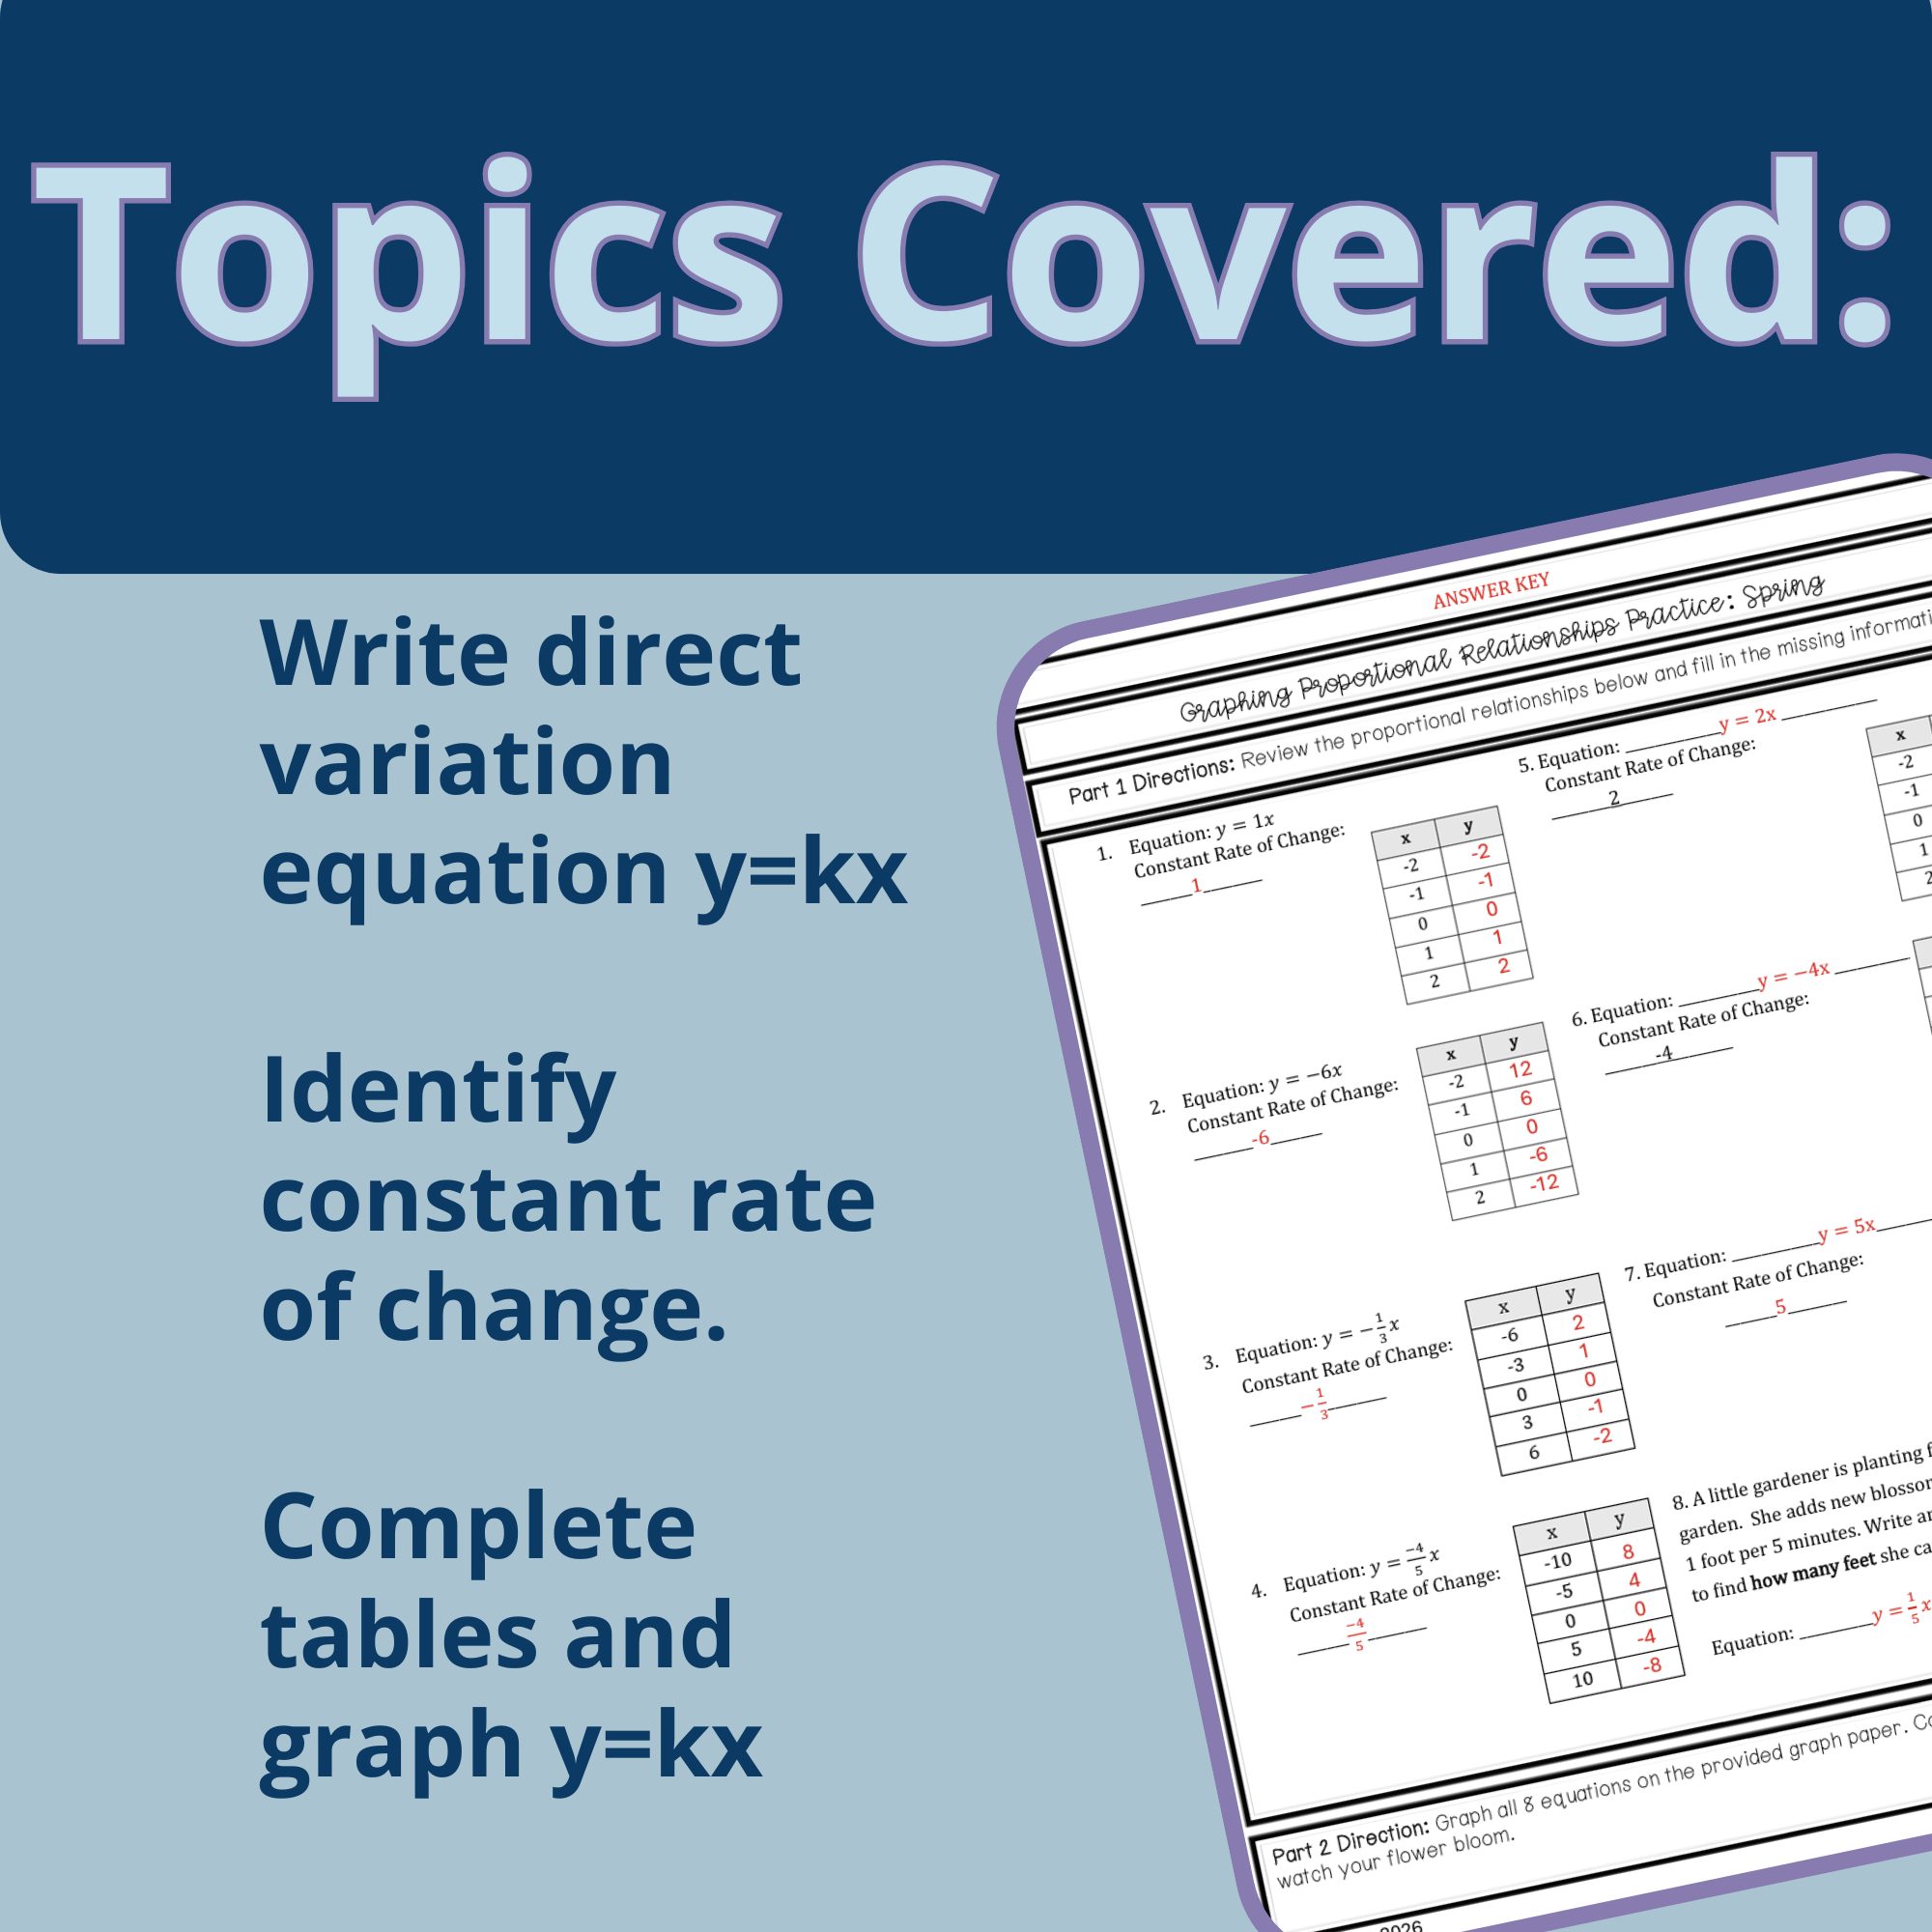
Master the art of graphing linear equations using the slope-intercept form (y = kx).
Confidently identify and interpret the constant rate of change.
Accurately plot coordinate points on the Cartesian plane.
Visually connect the algebraic representation of linear equations to their graphical representation.
💡How to Use This Resource:
This activity is a fantastic hands-on way to practice graphing linear equations in direct variation.
Students will first analyze each equation to find its constant rate of change.
As they graph all eight equations onto the provided grid, a beautiful coloring page will emerge!
The final product can be colored and displayed, making it a wonderful Spring bulletin board display or a festive takeaway.
Perfect as a no-prep holiday math lesson, a fun review activity, or an engaging sub plan.
✅ Perfect For...
6th Grade, 7th Grade, and 8th Grade Mathematics classrooms.
Teachers looking for engaging spring-themed math activities.
Reviewing linear equations in a hands-on way.
Creating a festive and educational bulletin board display.
Students who benefit from visual and kinesthetic learning experiences.
A no-prep worksheet or printable activity for busy educators.
🧠 The Pedagogy: Why It Works
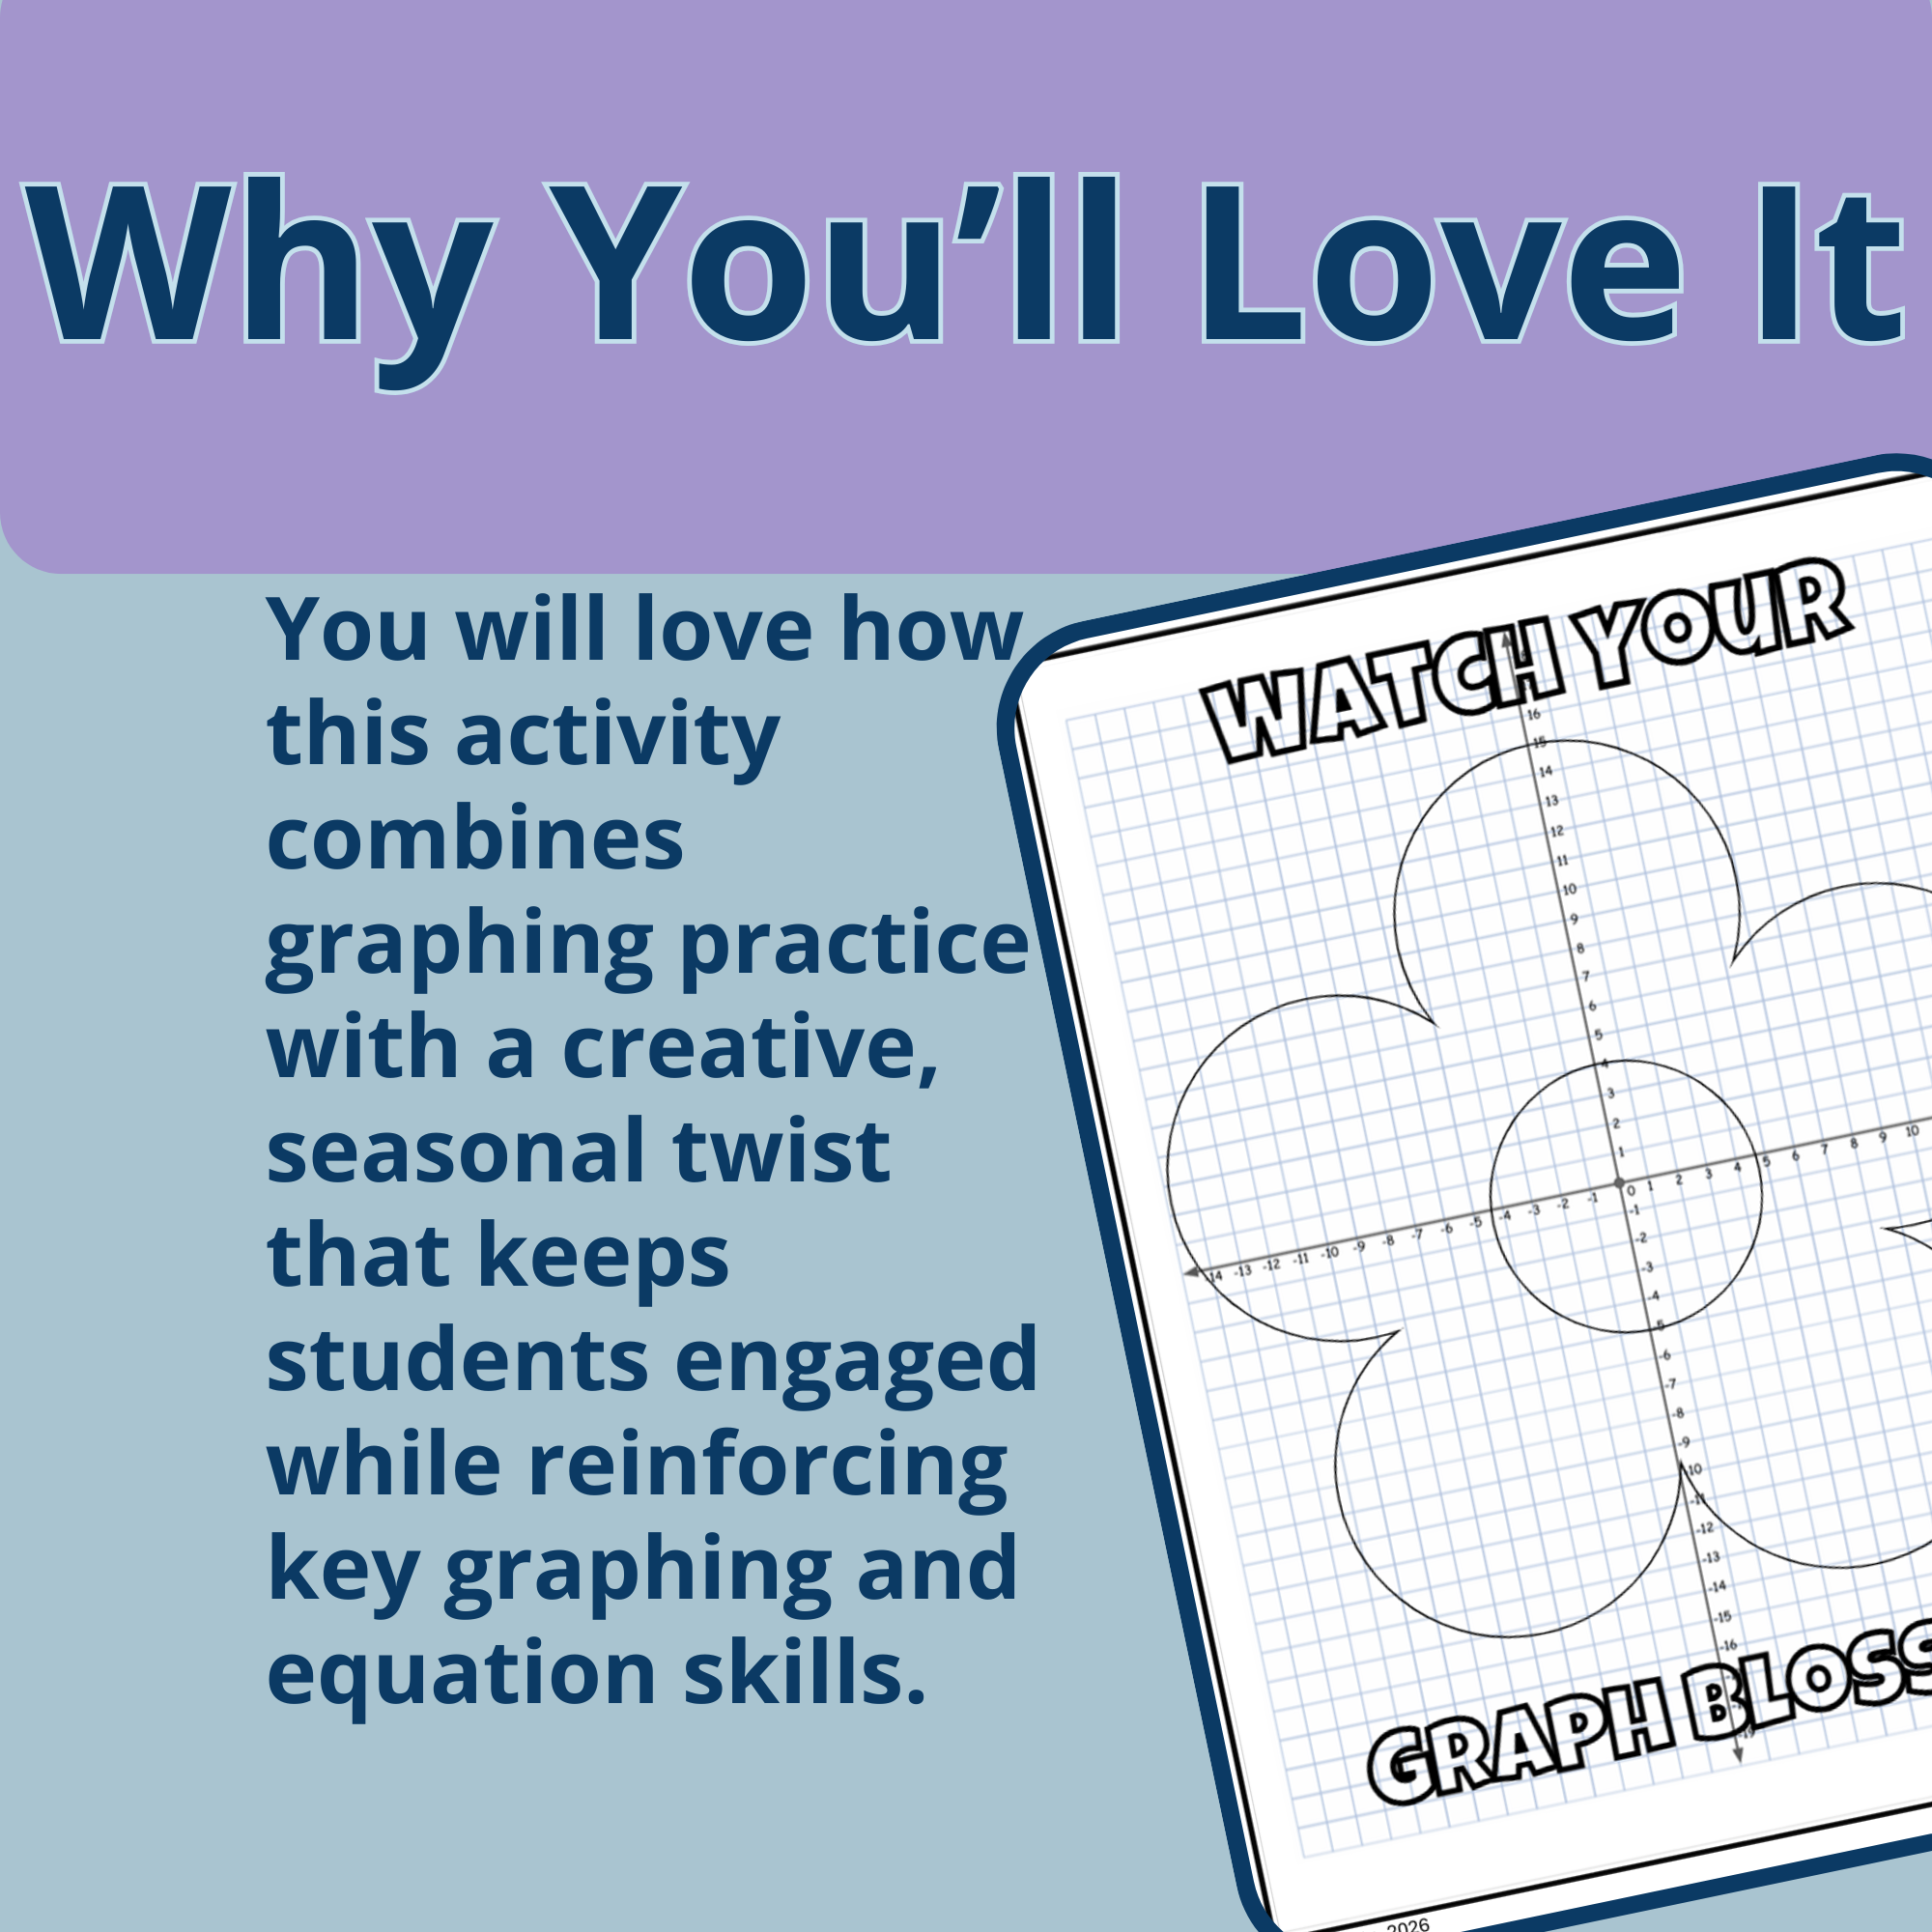
This resource is built around the power of hands-on activities. By physically graphing lines and seeing them form a cohesive image, students create a memorable connection between abstract algebraic concepts and visual outcomes. This multi-sensory approach reinforces learning and boosts retention, making the understanding of linear equations much more robust and enjoyable.
The project’s inherent structure, moving from equation analysis to plotting to artistic creation, provides a natural scaffolding that supports students of all levels. It encourages critical thinking as they interpret slope and intercept, and problem-solving as they ensure accurate plotting, all within a delightful, low-stakes holiday context.
Don't pass on this resource! Click Add to Cart now and sprinkle some graphing magic into your 6th, 7th, and 8th grade math classroom!
No results match your search. Try removing a few filters.