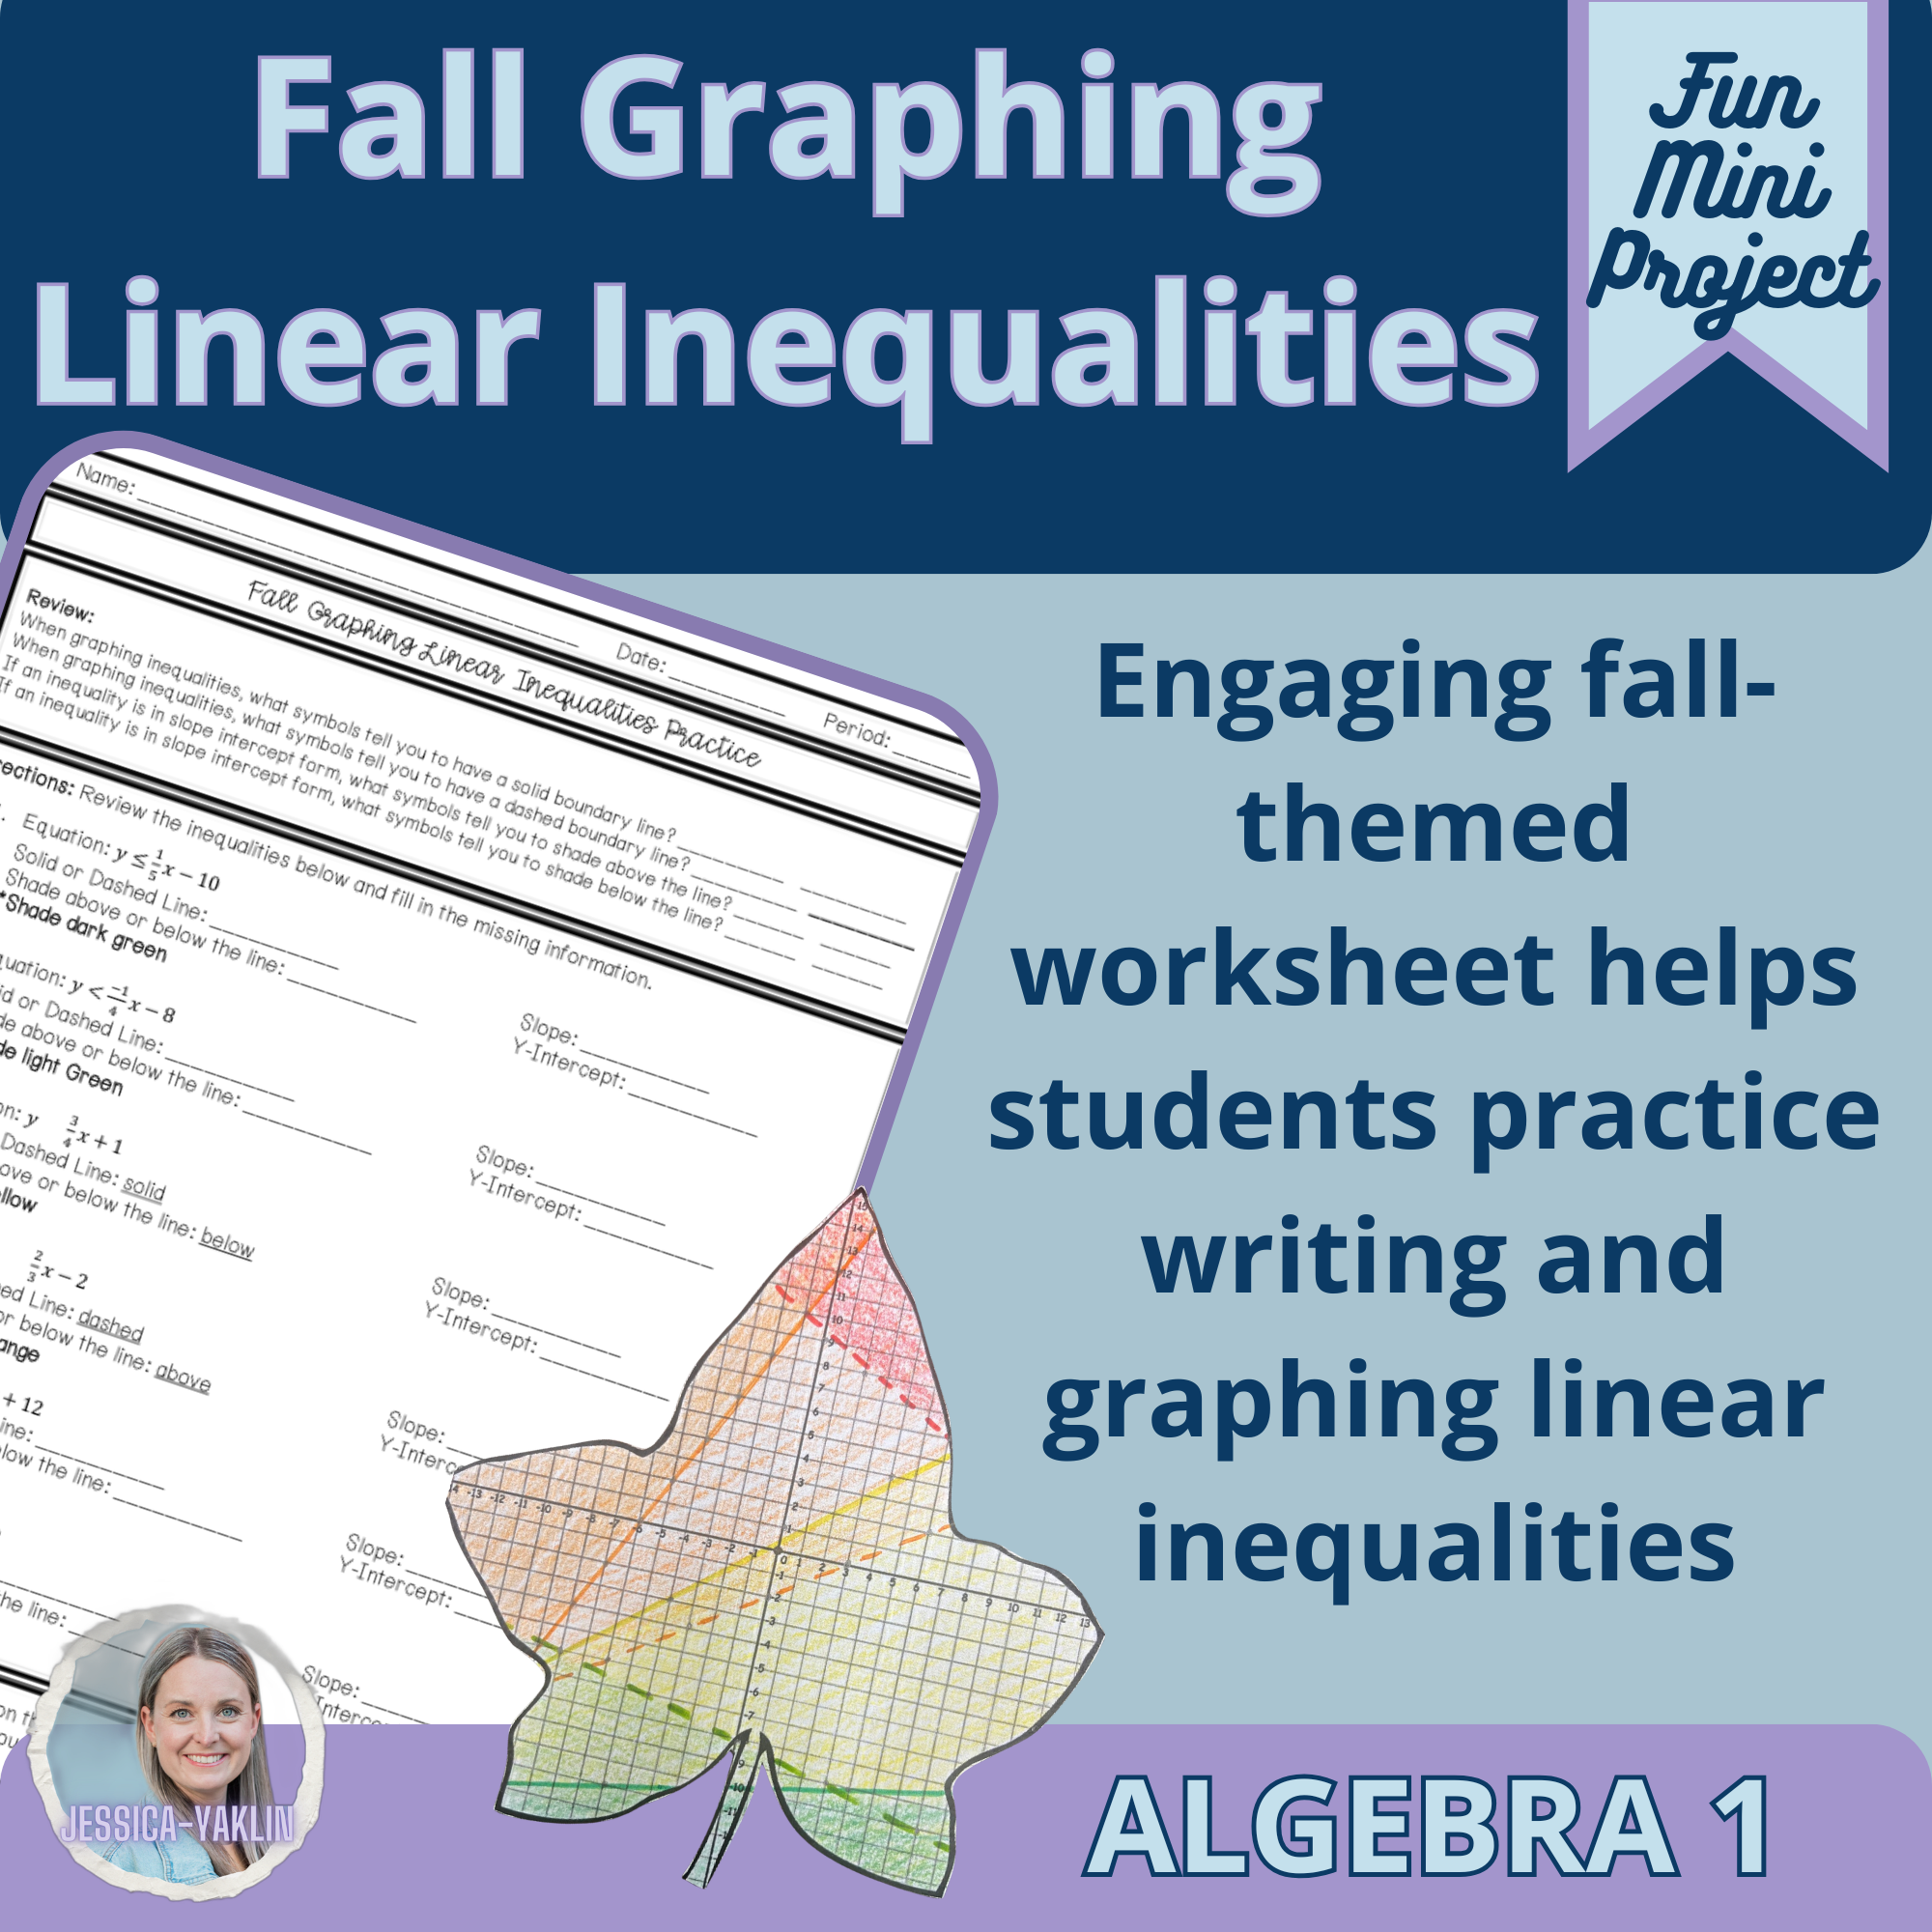
Give your students engaging, seasonal practice with graphing linear inequalities, identifying slope and y-intercept, and determining whether to use a solid or dashed boundary line. This fall-themed activity is perfect for warm-ups, math stations, partner work, review, test prep, or independent practice as students strengthen their understanding of graphing inequalities.
Students will graph six linear inequalities in slope-intercept form, shade the correct solution regions, and follow color-coded directions to create a fun fall-themed coloring page. The finished product makes a great classroom display or festive bulletin board!
6 linear inequalities in slope-intercept form, ready to be graphed!
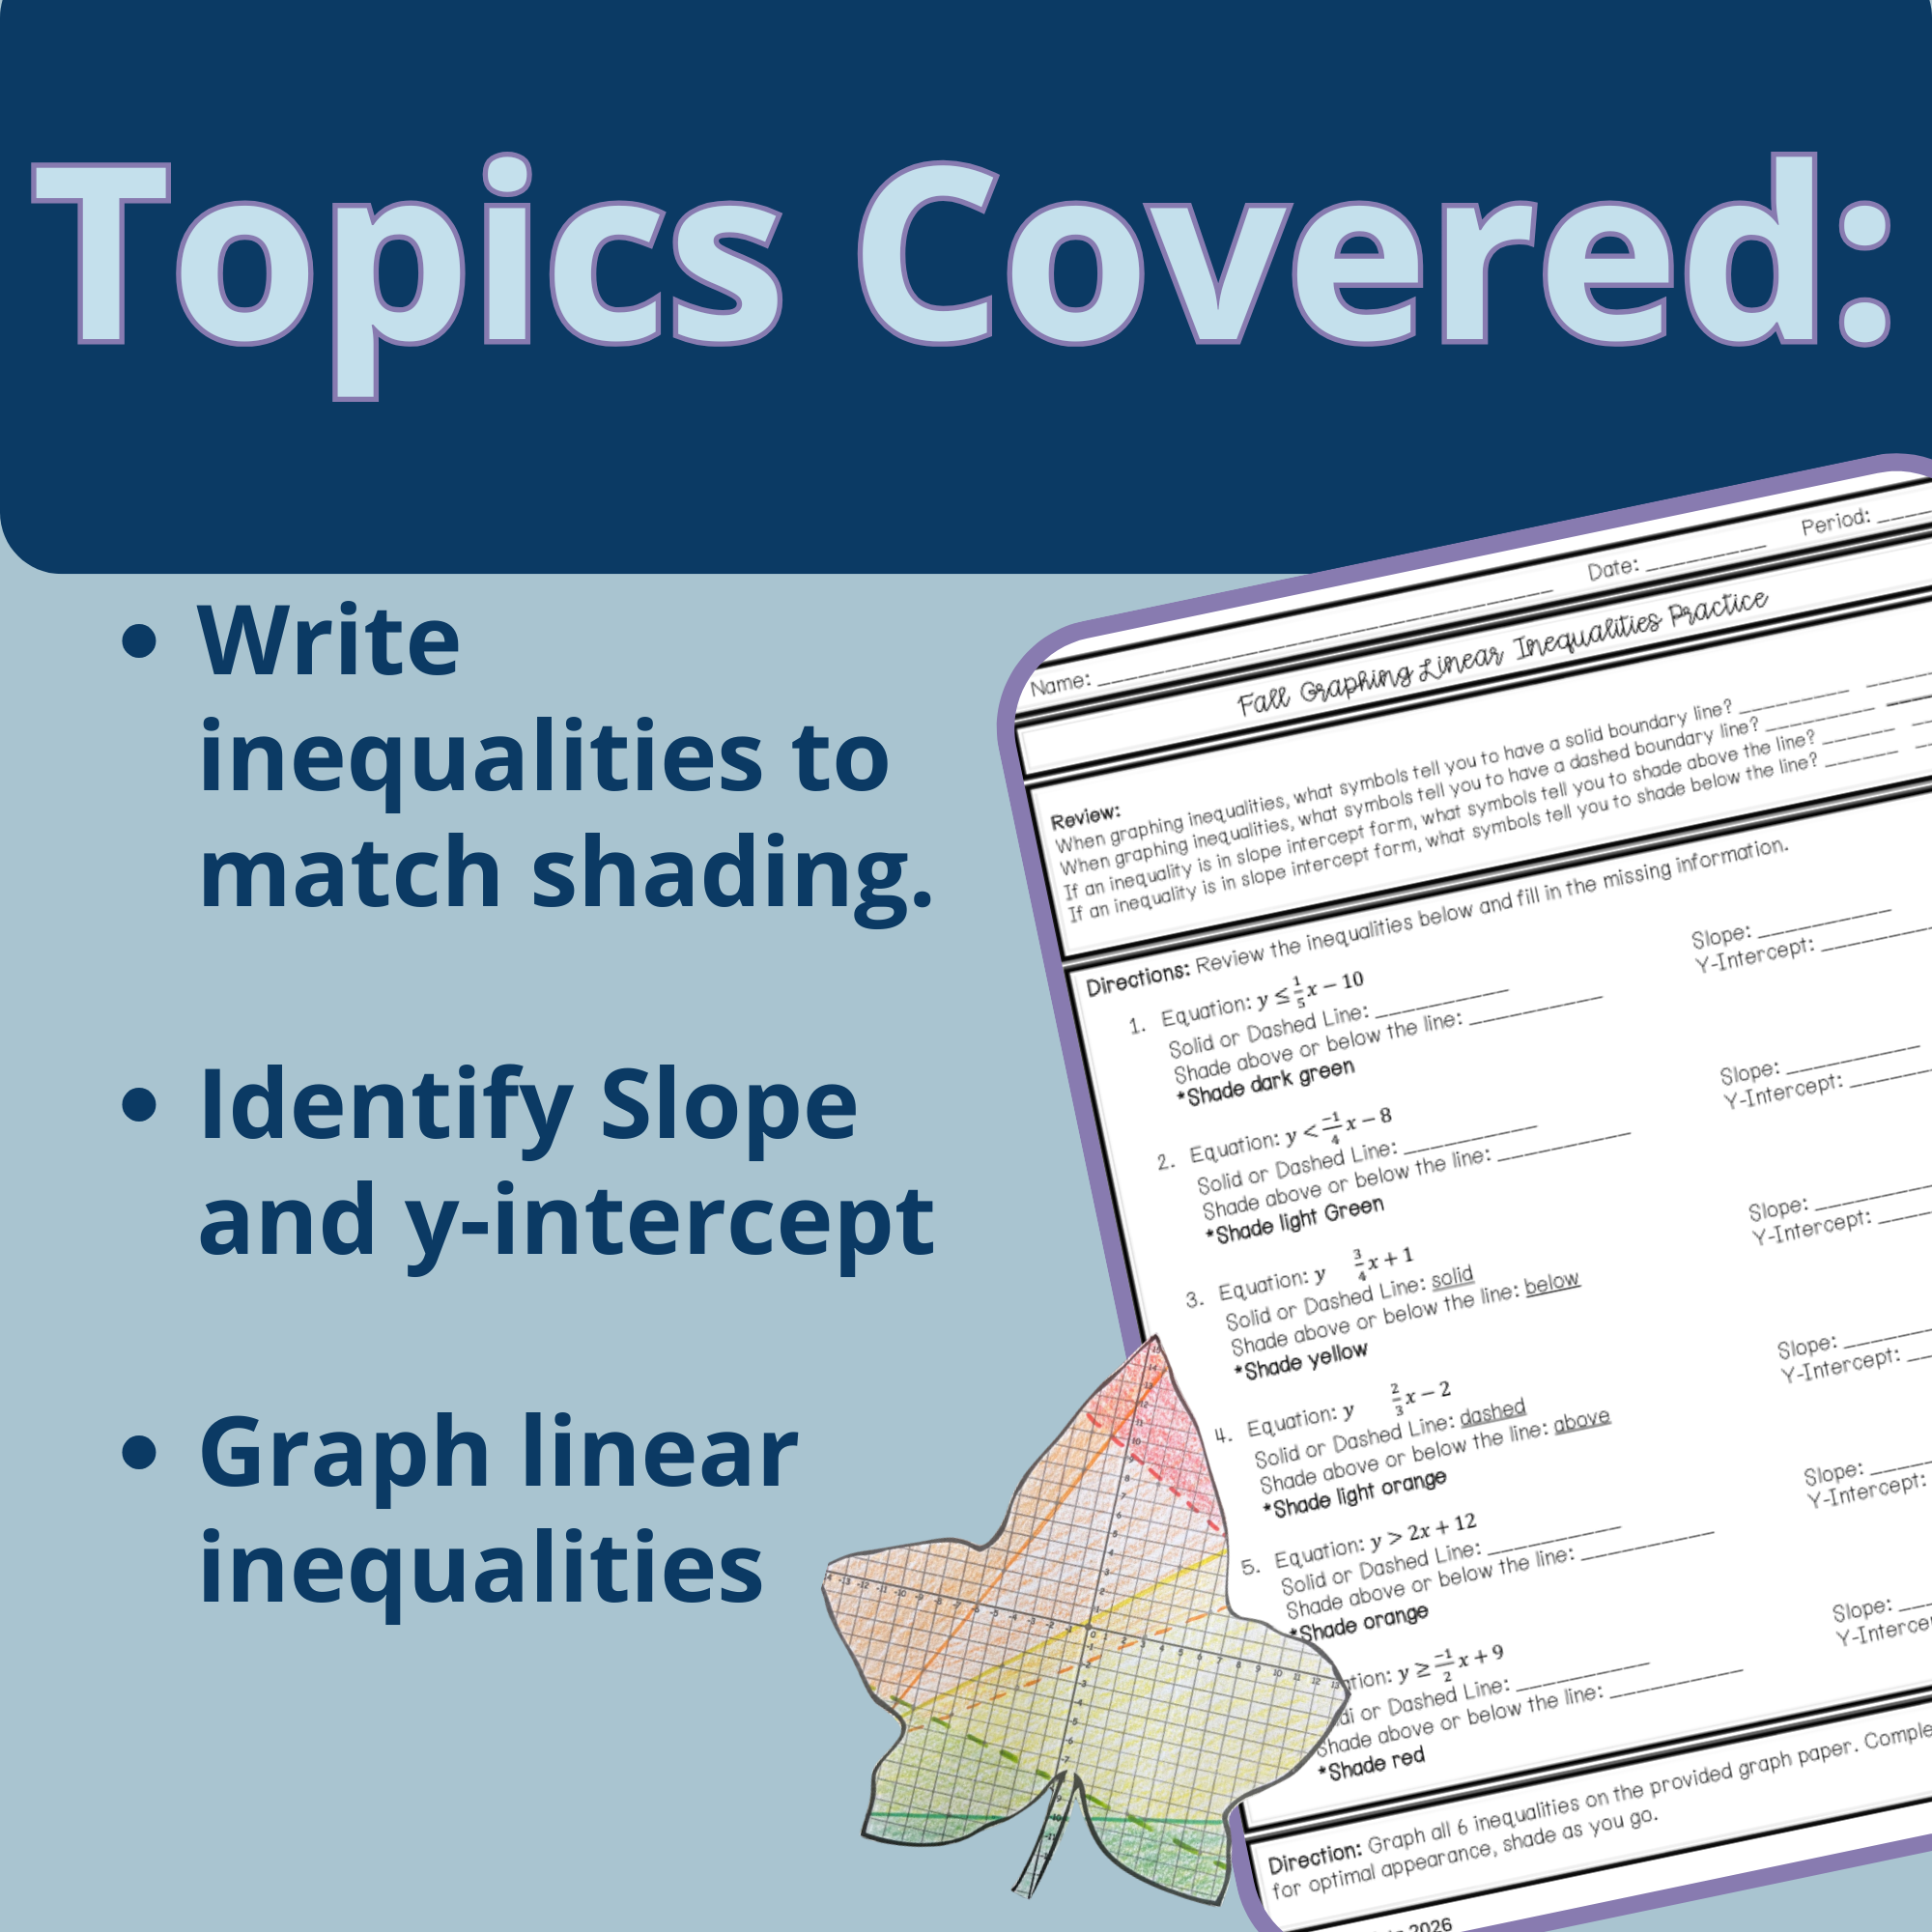
A dedicated student page for reviewing important graphing inequality rules.
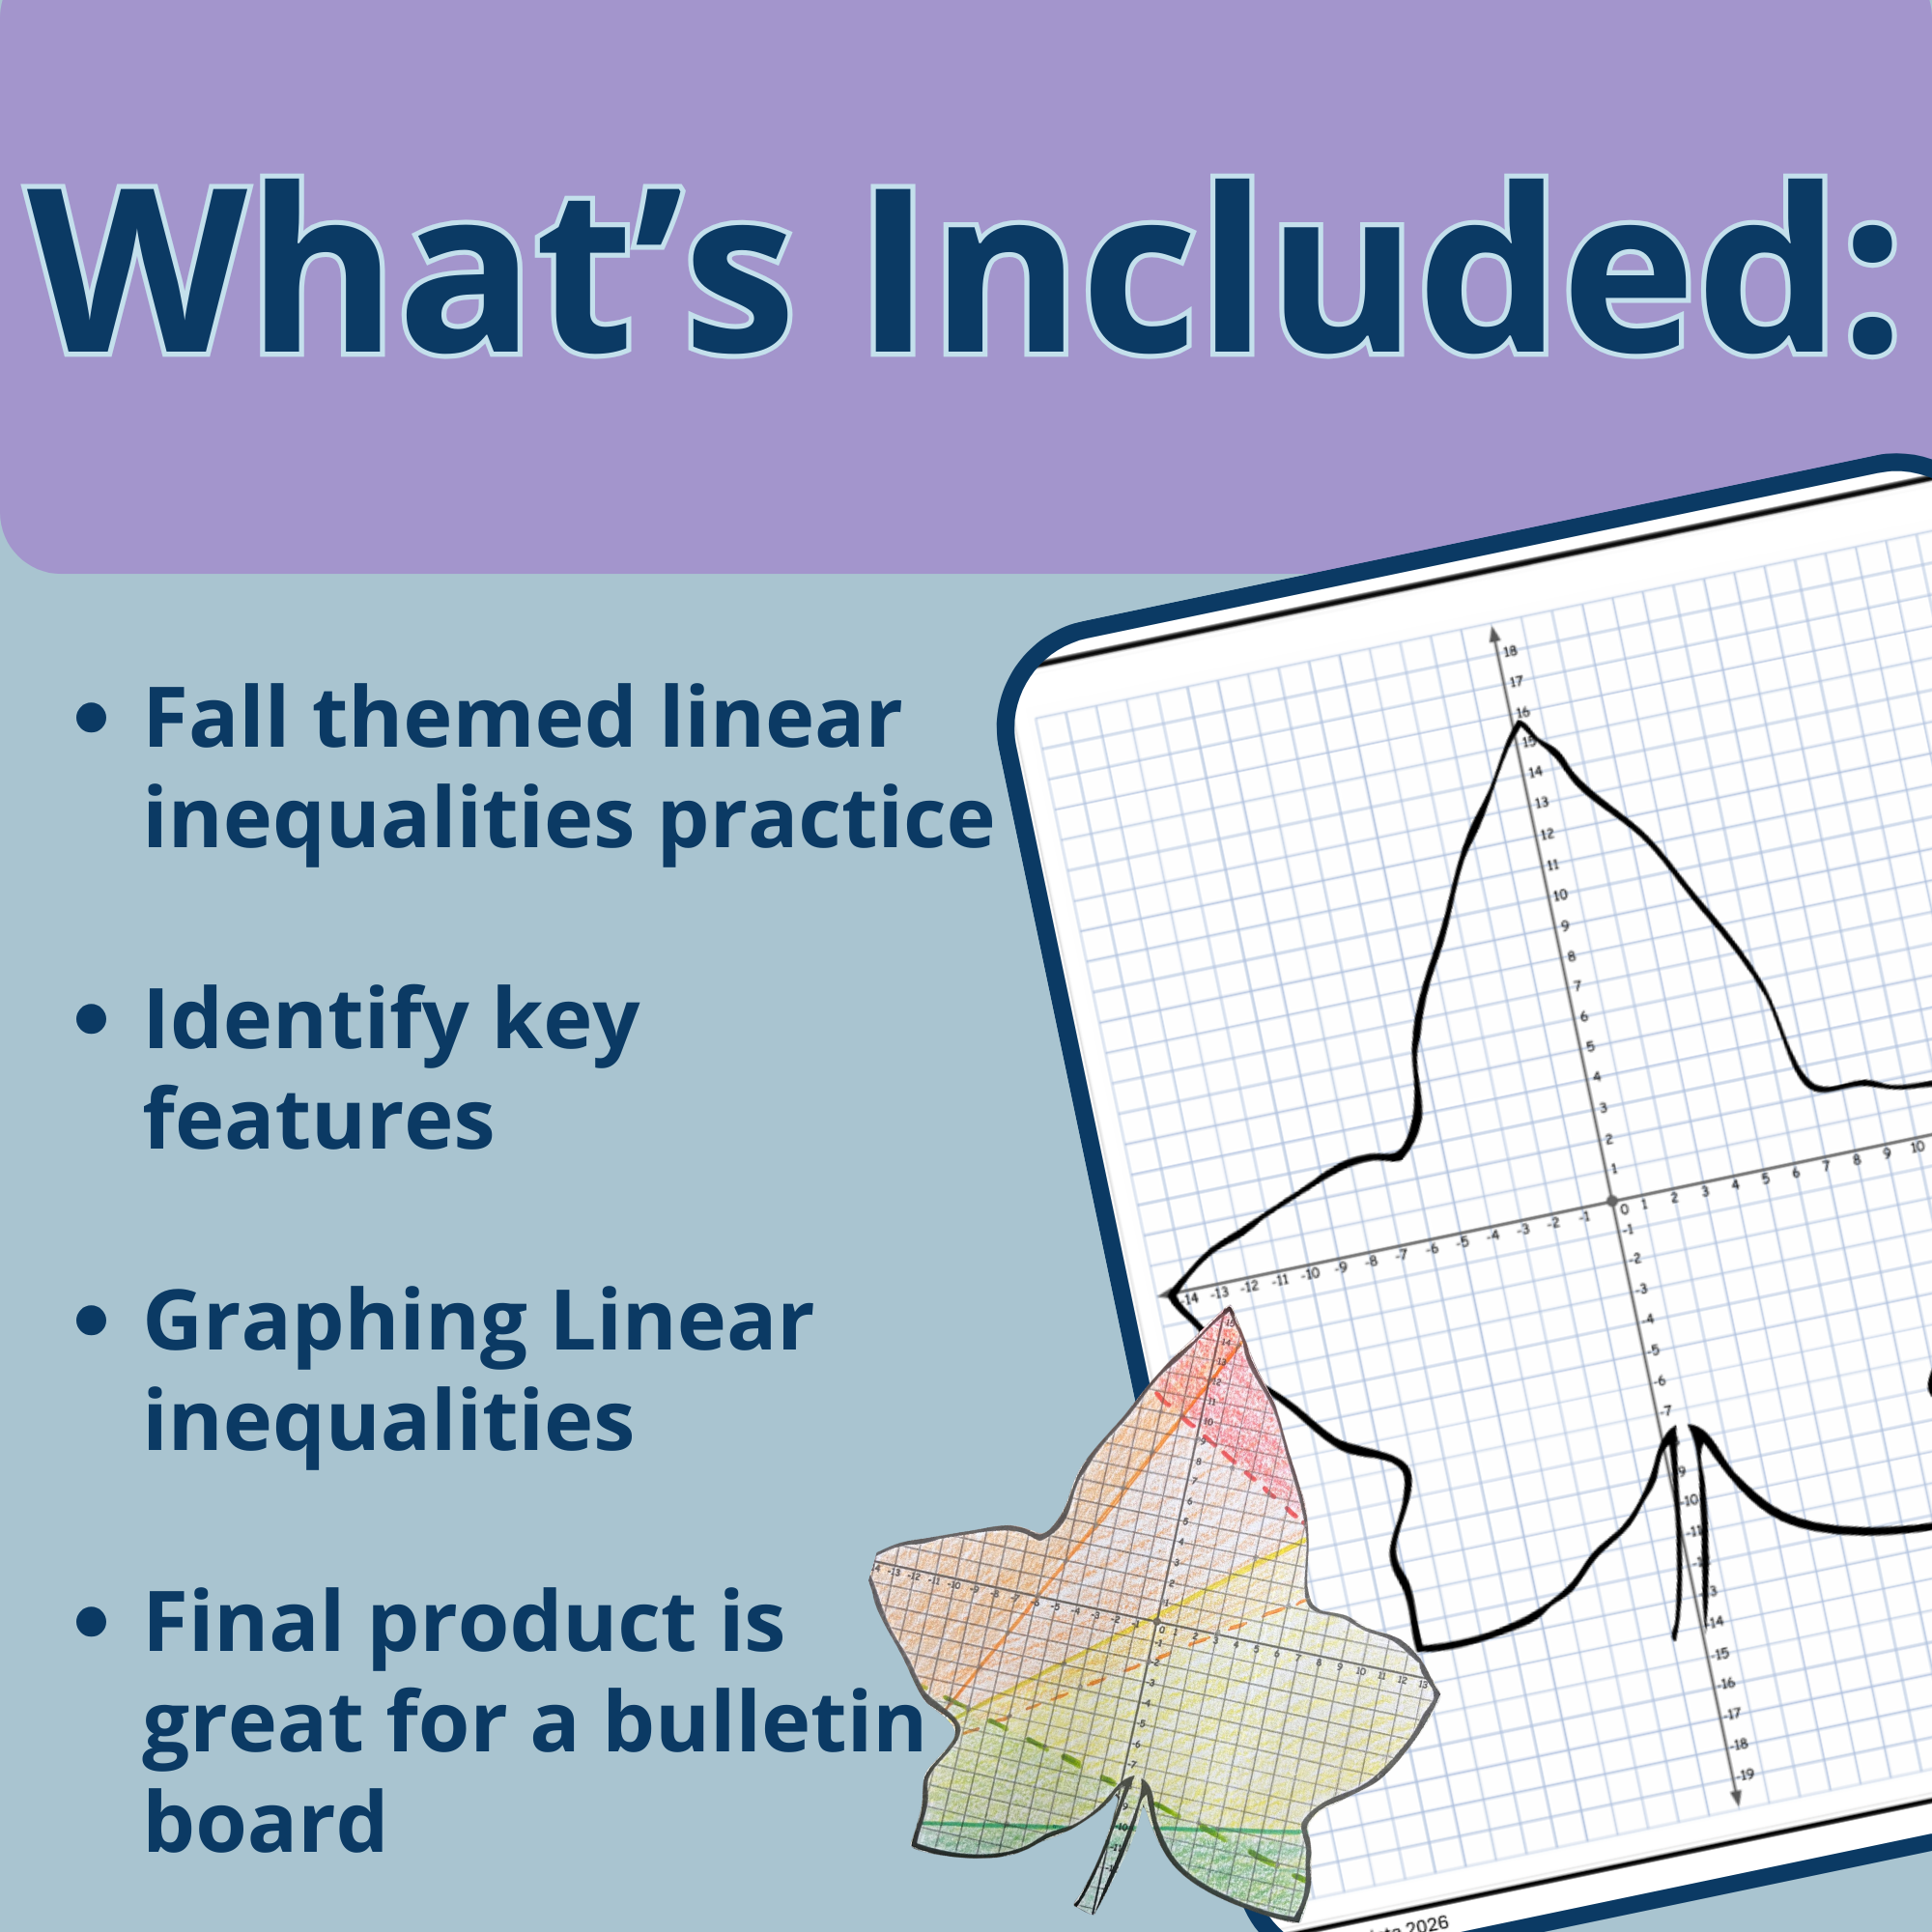
A spacious graphing page where all six inequalities come together to create a fun fall-themed design.
Clear, step-by-step directions that make this activity easy to implement.
A completed coloring page that can be displayed on a fall bulletin board or sent home for students to share.
Graph linear inequalities in slope-intercept form.
Identify and interpret the slope and y-intercept.
Determine when to use a solid or dashed boundary line.
Correctly shade the solution region of an inequality.
Connect algebraic representations of inequalities to their graphs on the coordinate plane.
This activity is a fun, hands-on way to practice graphing linear inequalities.
Students will first analyze each inequality and identify the slope, y-intercept, boundary line, and shading direction.
As students graph and shade all six inequalities, a festive fall coloring page will emerge!
The completed activity can be colored and displayed, making it a wonderful fall bulletin board display or seasonal classroom decoration.
Perfect as a no-prep fall math activity, engaging review lesson, test prep activity, or sub plan.
Pre-Algebra, 8th Grade Math, and Algebra 1 classrooms.
Teachers looking for engaging fall-themed math activities.
Practicing and reviewing graphing linear inequalities.
Math stations, partner activities, or independent practice.
Creating a festive and educational bulletin board display.
Students who benefit from visual and hands-on learning experiences.
A no-prep printable activity for busy math teachers.
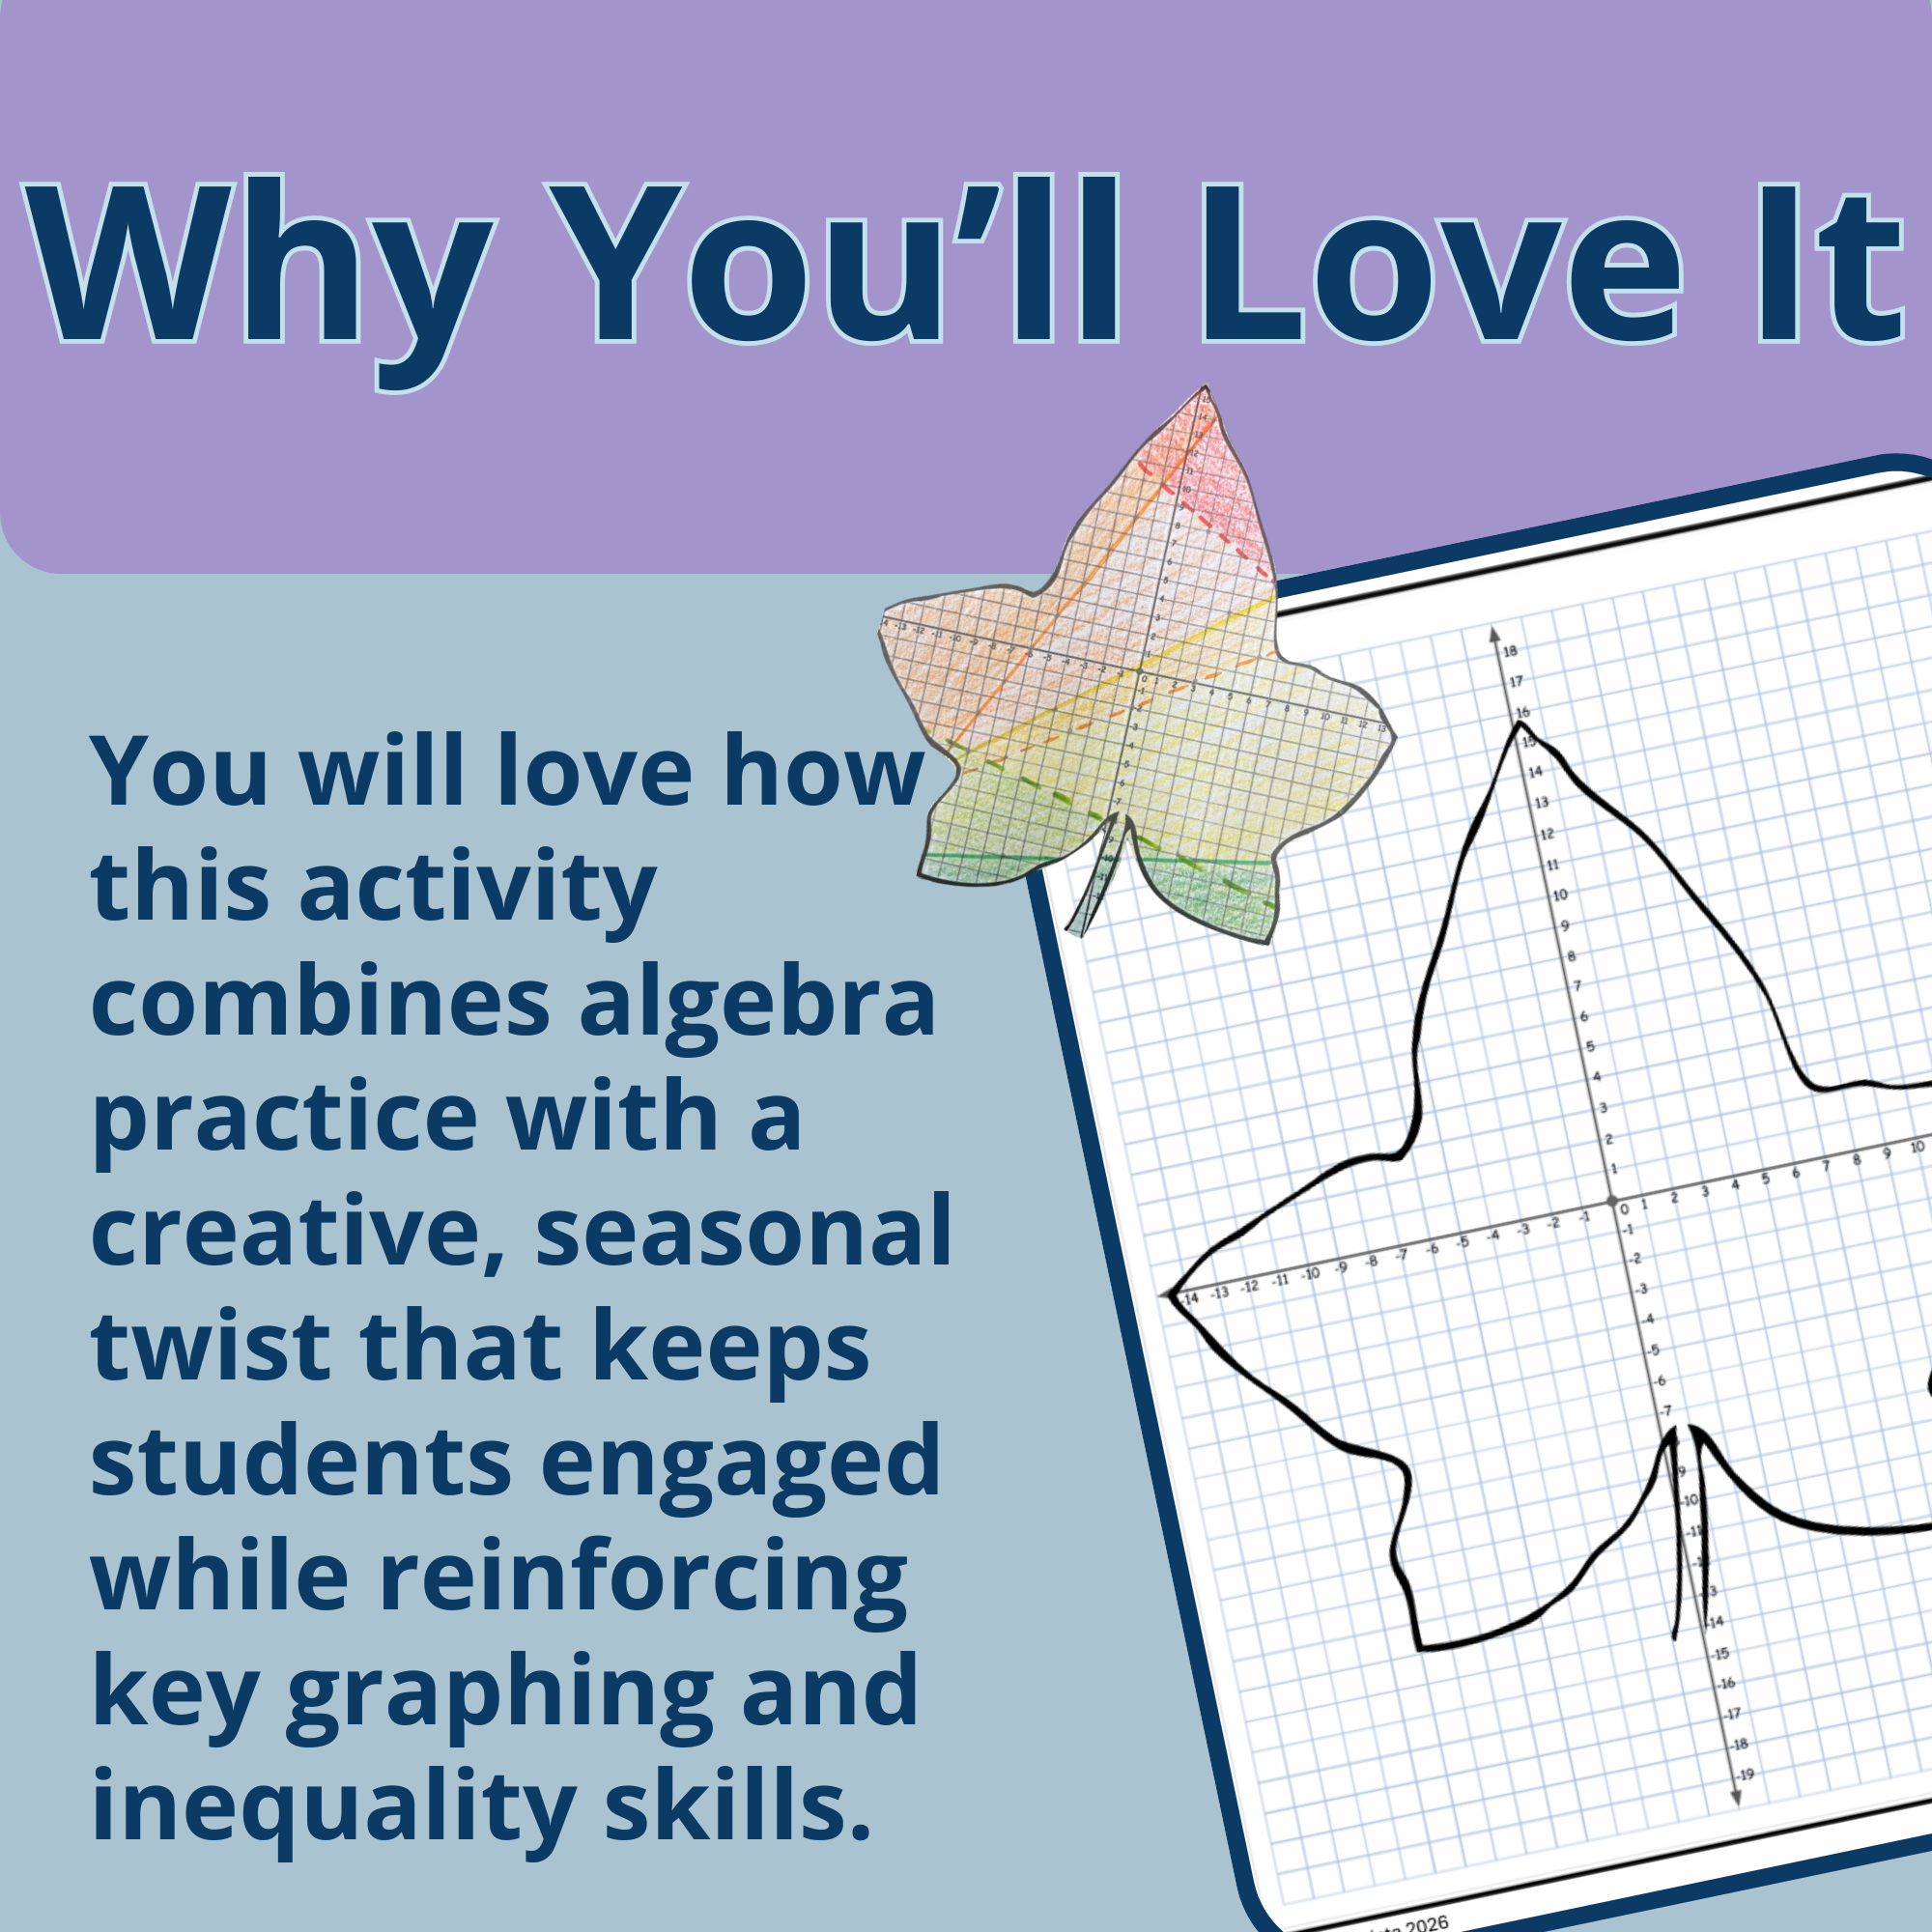
This resource combines algebraic thinking with visual learning. Instead of simply graphing one inequality at a time, students see how multiple inequalities and shaded regions work together to create a complete image. This helps students make meaningful connections between slope, y-intercept, boundary lines, and solution regions.
The activity also provides natural scaffolding. Students move from analyzing each inequality to graphing the boundary line, deciding whether it should be solid or dashed, and determining which side to shade. The final coloring component adds a creative and seasonal element that makes practicing an important Algebra skill feel more engaging and memorable.
Bring some fall fun to your math classroom! Add this Fall Graphing Linear Inequalities Activity to your cart and give your students meaningful, hands-on practice with a finished product they'll be proud to display.
Give your students engaging, seasonal practice with graphing linear inequalities, identifying slope and y-intercept, and determining whether to use a solid or dashed boundary line. This fall-themed activity is perfect for warm-ups, math stations, partner work, review, test prep, or independent practice as students strengthen their understanding of graphing inequalities.
Students will graph six linear inequalities in slope-intercept form, shade the correct solution regions, and follow color-coded directions to create a fun fall-themed coloring page. The finished product makes a great classroom display or festive bulletin board!
6 linear inequalities in slope-intercept form, ready to be graphed!
A dedicated student page for reviewing important graphing inequality rules.
A spacious graphing page where all six inequalities come together to create a fun fall-themed design.
Clear, step-by-step directions that make this activity easy to implement.
A completed coloring page that can be displayed on a fall bulletin board or sent home for students to share.
Graph linear inequalities in slope-intercept form.
Identify and interpret the slope and y-intercept.
Determine when to use a solid or dashed boundary line.
Correctly shade the solution region of an inequality.
Connect algebraic representations of inequalities to their graphs on the coordinate plane.
This activity is a fun, hands-on way to practice graphing linear inequalities.
Students will first analyze each inequality and identify the slope, y-intercept, boundary line, and shading direction.
As students graph and shade all six inequalities, a festive fall coloring page will emerge!
The completed activity can be colored and displayed, making it a wonderful fall bulletin board display or seasonal classroom decoration.
Perfect as a no-prep fall math activity, engaging review lesson, test prep activity, or sub plan.
Pre-Algebra, 8th Grade Math, and Algebra 1 classrooms.
Teachers looking for engaging fall-themed math activities.
Practicing and reviewing graphing linear inequalities.
Math stations, partner activities, or independent practice.
Creating a festive and educational bulletin board display.
Students who benefit from visual and hands-on learning experiences.
A no-prep printable activity for busy math teachers.
This resource combines algebraic thinking with visual learning. Instead of simply graphing one inequality at a time, students see how multiple inequalities and shaded regions work together to create a complete image. This helps students make meaningful connections between slope, y-intercept, boundary lines, and solution regions.
The activity also provides natural scaffolding. Students move from analyzing each inequality to graphing the boundary line, deciding whether it should be solid or dashed, and determining which side to shade. The final coloring component adds a creative and seasonal element that makes practicing an important Algebra skill feel more engaging and memorable.
Bring some fall fun to your math classroom! Add this Fall Graphing Linear Inequalities Activity to your cart and give your students meaningful, hands-on practice with a finished product they'll be proud to display.